
Read your analytics
Understand clicks, unique visitors, sources and the best time to post, and what gets filtered out.
Open Analytics
Analytics answers four questions about your links: how many people clicked, when, where they came from, and which links they chose. This is a tour of the Overview and what each part tells you.
Pick a period
Open Analytics. The date menu at the top right starts on Last 30 days; every number on the page is compared with the period before it.
Read the headline numbers
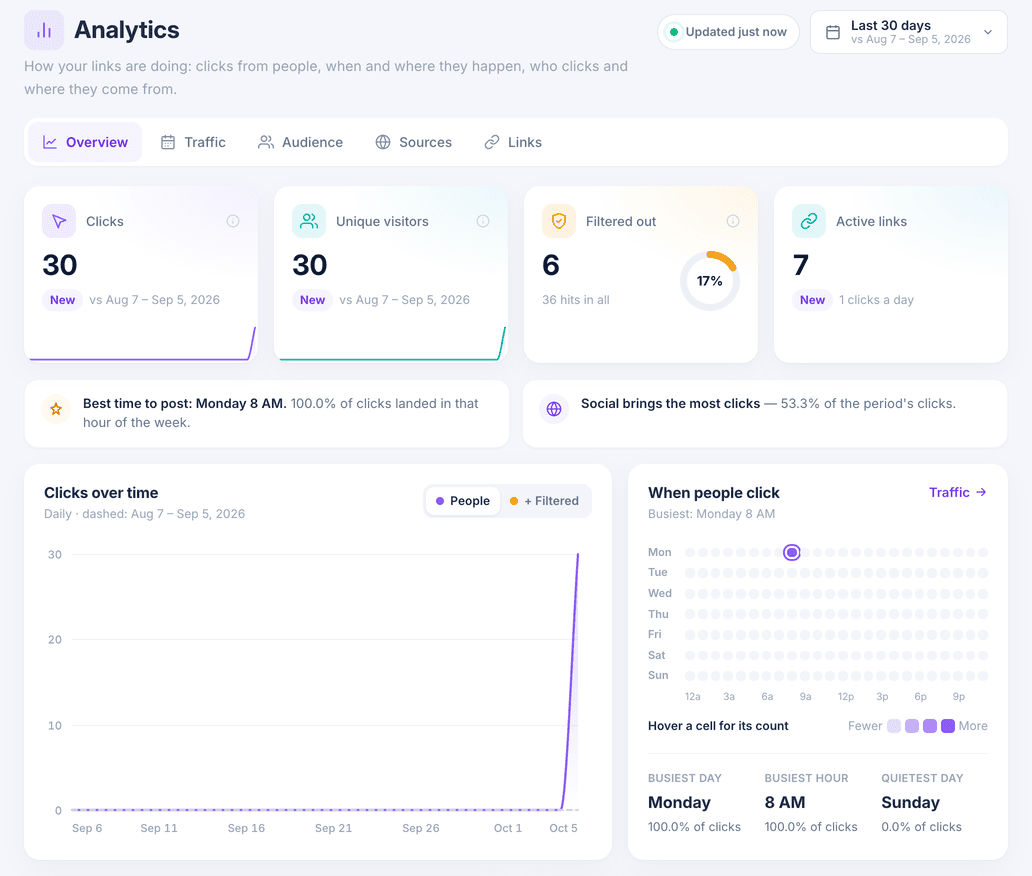
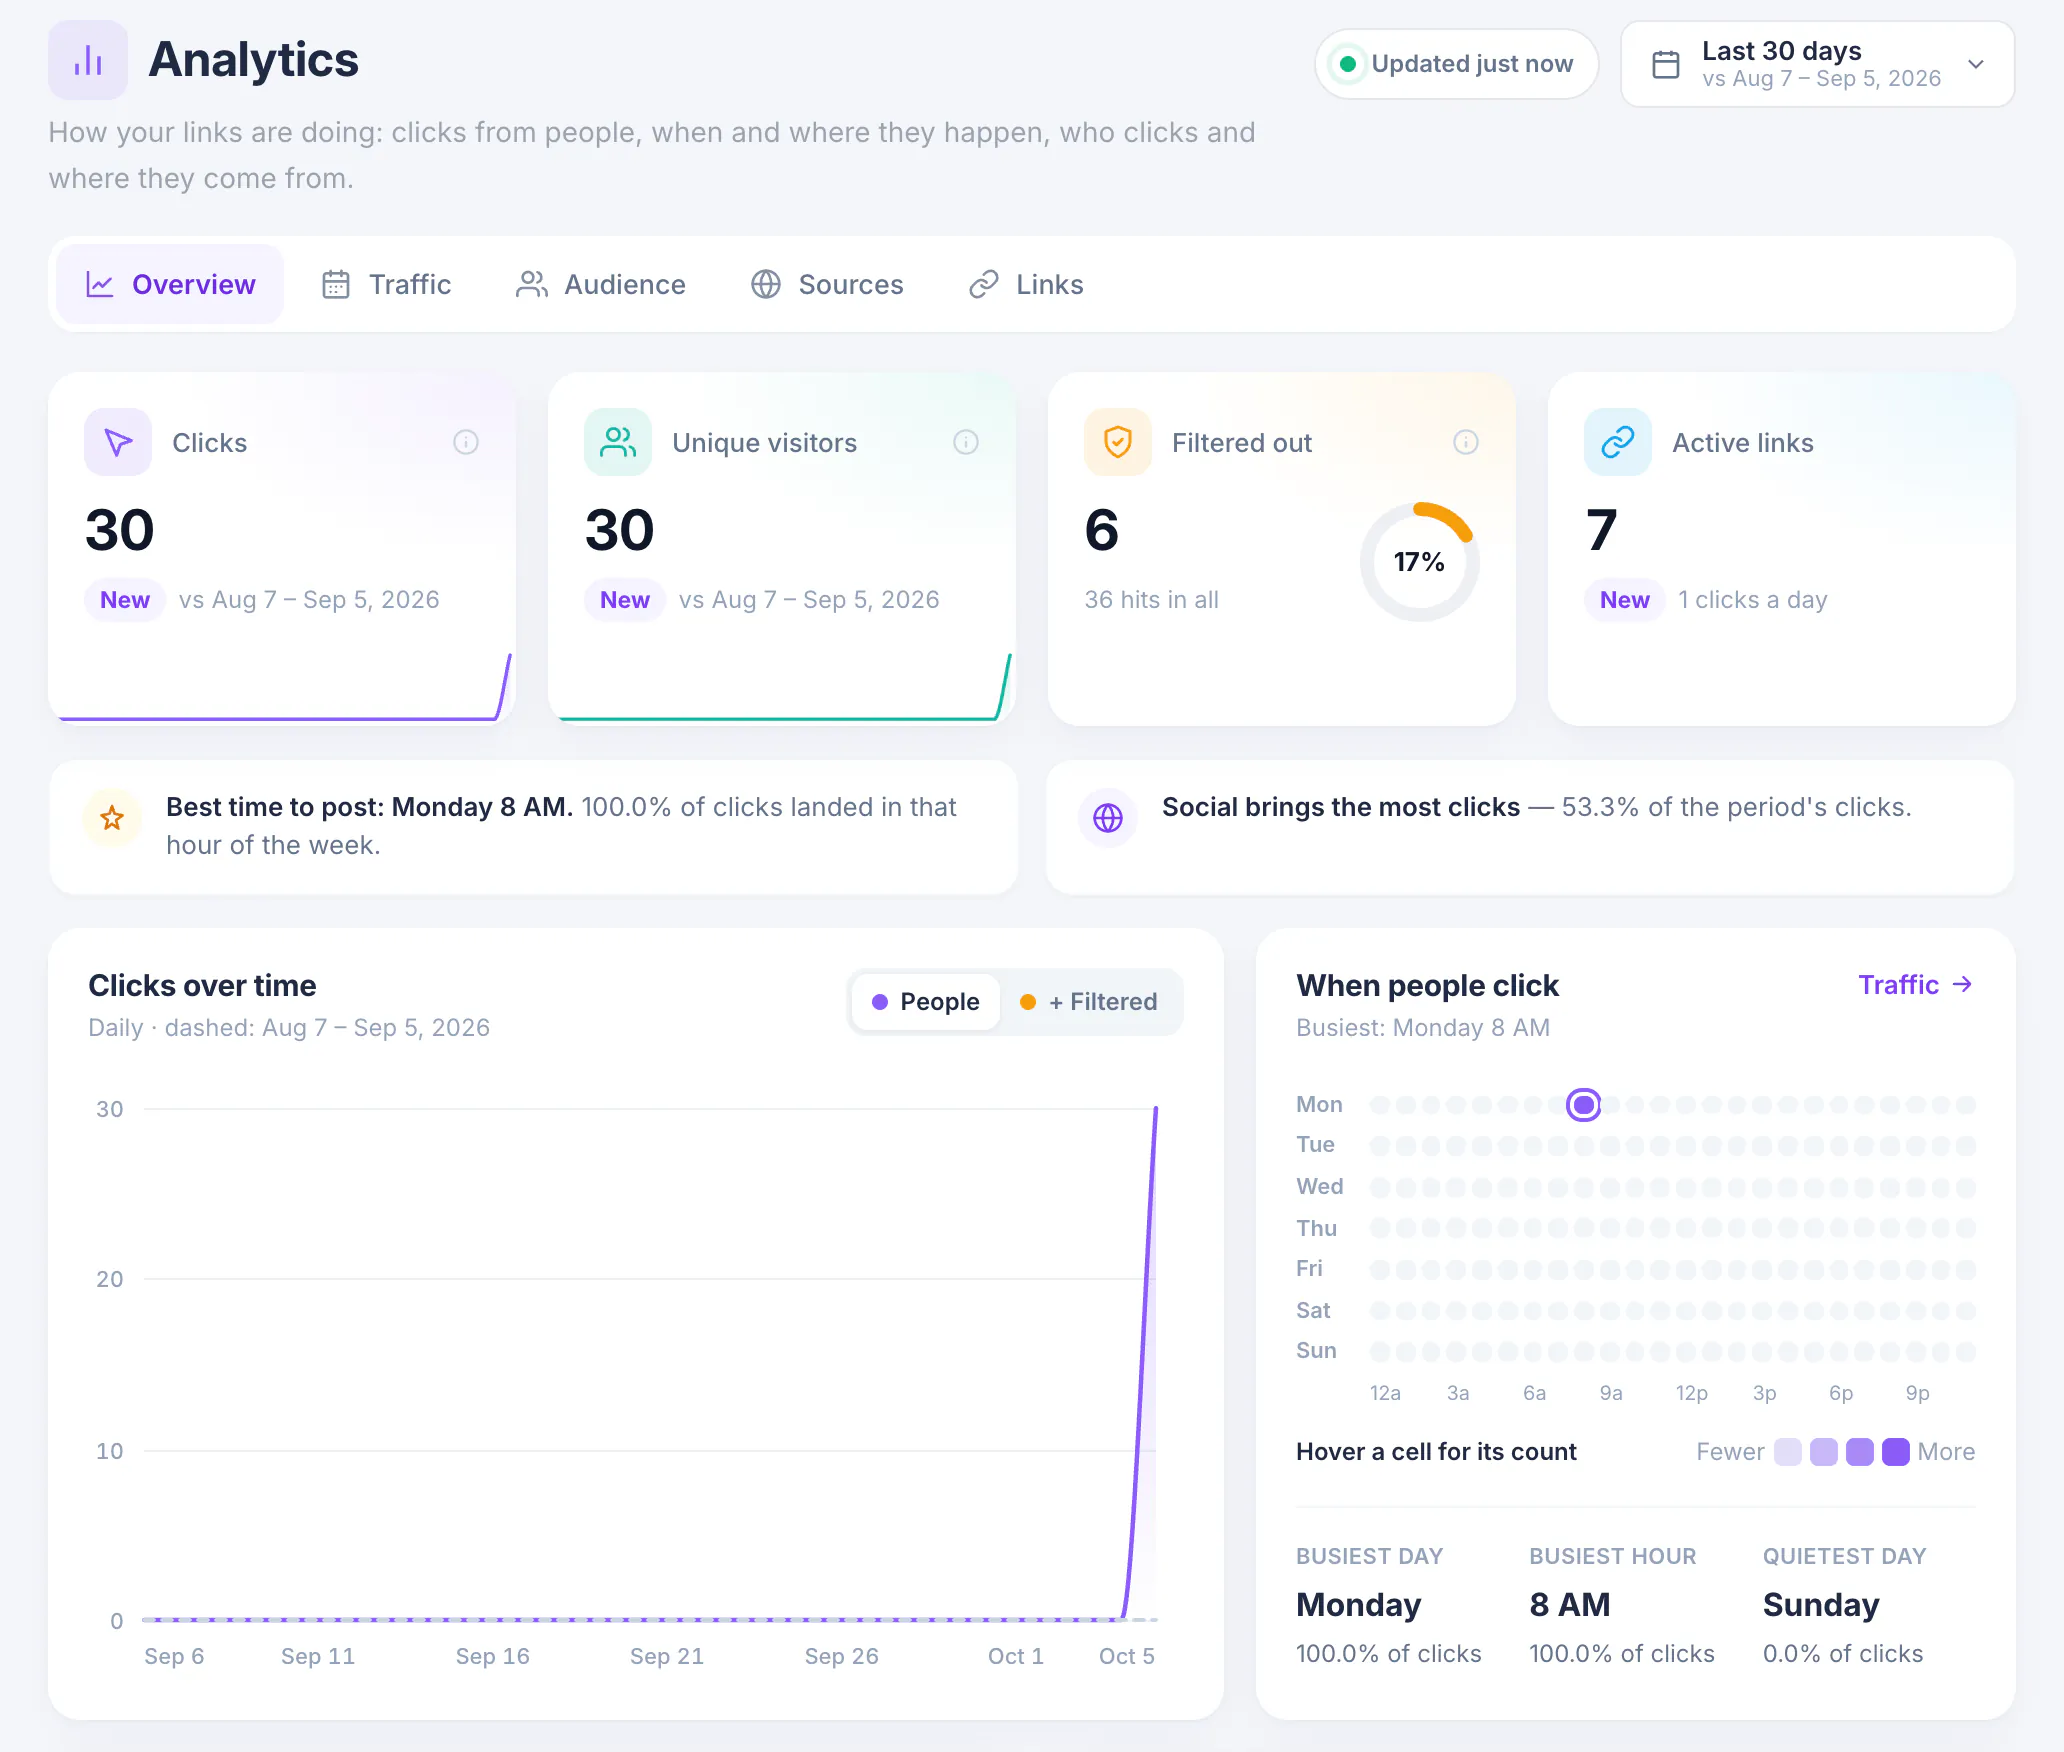
Clicks counts visits from people. Unique visitors counts each person once. Active links is how many of your links were clicked in the period.
Filtered out shows hits that were not people: bots, link previews made by chat and social apps, and browser prefetching. They still redirect, but they never inflate your reports.
Find your best time
Clicks over time plots each day; switch between People and + Filtered to see what filtering removed. When people click is a week-by-hour heatmap with your busiest day and hour called out underneath.
See what works
Top links ranks links by clicks. Where clicks come from groups visits into sources such as Social, Email, Search and Direct.
The tabs go deeper: Traffic for timing, Audience for countries, devices and languages, Sources for referrers, and Links to compare individual links.
Compare individual links
The Links tab lists every link that was clicked in the period, by Most clicks or Fastest growing. Tick up to four links to compare them side by side.
What you have now
You can tell which links and channels perform, and when your audience is most likely to click.